Preliminary Work
- Select a continuous measurement parameter (e.g., viscosity).
- Determine a suitable measuring instrument.
- Select several different manufactured parts that cover the relevant characteristic range.
- Select several inspectors.
- Determine the number of repeat measurements per inspector.
- Define the measurement conditions and keep them constant.
- Create a worksheet for Type 2 MSA
- Perform measurements: Ideally, measurements are performed by inspector in random order; repeat measurements by a single inspector are performed at separate times.
 Use in AlphadiTab
- In the Measure phase, consistently select the MSA Type 2 tool.
- Select “Inspector” for the operator.
- For “Part,” select “Part.”
- For measurements, select “Measured Value”.
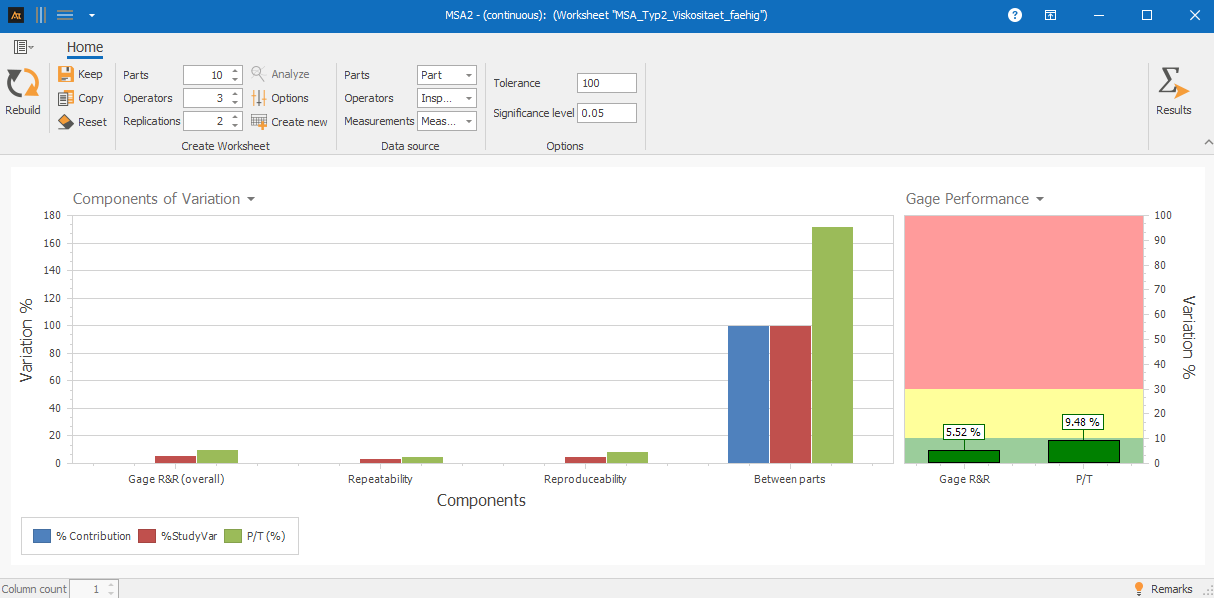
- Enter the value 100 for “Tolerance”.
- Perform the analysis using the “Create New” button.
Interpretation
Check whether the measurement system is capable:
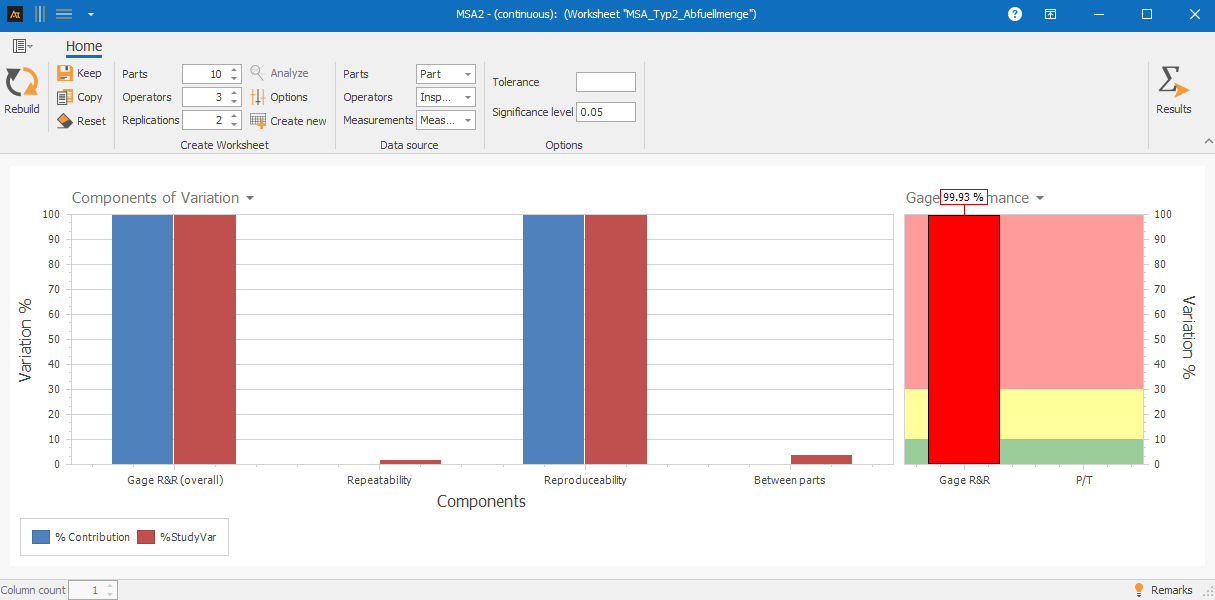
% Gage R&R < 10% → Measurement system is considered very good / acceptable
10% ≤ % Gage R&R ≤ 30% → Measurement system is conditionally acceptable depending on the application
% Gage R&R > 30% → Measurement system is not acceptable and should be improved
Continuous measurement data
Continuous measurement data is required to perform a Type 2 measurement system analysis.
Why is this important?
Only with continuous measurement data can the repeatability and reproducibility of the measurement system be evaluated.
This data is collected using a measuring instrument and allows for a quantitative assessment of the measurement system variation.
Multiple produced parts
There must be multiple different, actual production parts available that cover the relevant characteristic range of the process.
Why is this important?
This is the only way to evaluate the influence of part variation on the measurement result.
Multiple inspectors (or a factor with multiple levels)
The measurements must be performed by multiple inspectors.
The inspectors represent the different levels of a factor (e.g., Inspector 1, Inspector 2, Inspector 3).
Why is this important?
In Type 2 MSA, in addition to repeatability, it is examined whether the measurement results differ between the levels of this factor.
In practice, this factor is usually the inspector, but it can also be replaced by other clearly distinguishable groups (e.g., locations or shifts).
Same measuring equipment
All measurements must be performed using the same measuring equipment, as the analysis evaluates the measuring system as a whole.
Constant measurement conditions
The sample, measuring equipment, inspector, and environmental conditions (e.g., temperature) must be kept constant during the measurement.
Why is this important?
Only under constant conditions can it be ensured that observed fluctuations in the measured values are attributable exclusively to the measuring equipment.
Normally distributed data
The repeated measurement values should show no indication of a significant deviation from the normal distribution, since the calculation of the metrics is based on assumptions of normal distribution
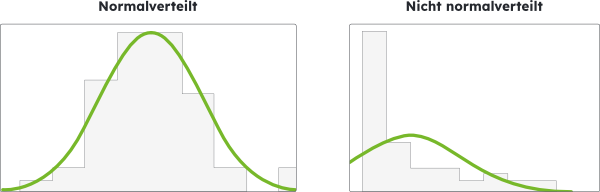
Why is this important?
In the event of a significant deviation from the normal distribution, %Gage R&R and %Tol do not provide reliable information about measurement capability.
The evaluation of measurement instrument variation can therefore become inaccurate or misleading.