Purpose of the tool
Procedure
Settings
Interpretation guide
Forms of representation
Requirements
Tools
Examples
Terms
Formulas
-
Purpose of the tool
The two-sample proportion test is used to determine whether the proportions of two groups differ statistically significantly.
It is used to assess whether an observed difference between two proportions goes beyond random variation. It is based on a hypothesis test for binary events (event / no event).
- p ≤ α → accept H₁ (reject H₀)
- p > α → Retain H₀
-
Example: Leaky lids
A tomato sauce manufacturer wants to determine whether the proportion of leaky jars differs between two filling lines.
To do this, the manufacturer records for both lines how many jars fail the leak test and how many jars were tested in total:
- Line A: 30 out of 100 jars are leaky
- Line B: 50 out of 100 jars are leaking
Using the proportion test with two samples, we determine whether the observed difference in the rejection rates is statistically significant or can be explained by chance.
Interpretation of the results:
The calculated p-value is below the significance level of 0.05, so the null hypothesis is rejected. We conclude that the proportions for the two filling lines differ.
There is thus statistical evidence that the probability of leaky jars is not the same on the two lines.
Explanations of the graph:
- The points mark the observed sample proportions for the two filling lines.
- The error bars represent the 95% confidence interval for the respective proportions.
- If the confidence intervals overlap little or not at all, this indicates a statistically significant difference (the decision is made based on the p-value).
-
Procedure
(How was this graphic created?)
Preliminary Work
- Select a binary event (e.g., lid sealed: Yes/No or label correct: Yes/No).
- Define two groups whose proportions are to be compared (e.g., Filling Line A vs. Filling Line B or Supplier 1 vs. Supplier 2).
- Set the significance level α (usually α = 0.05).
- Ensure that the observations within and between the groups were collected independently of one another.
Use in AlphadiTab
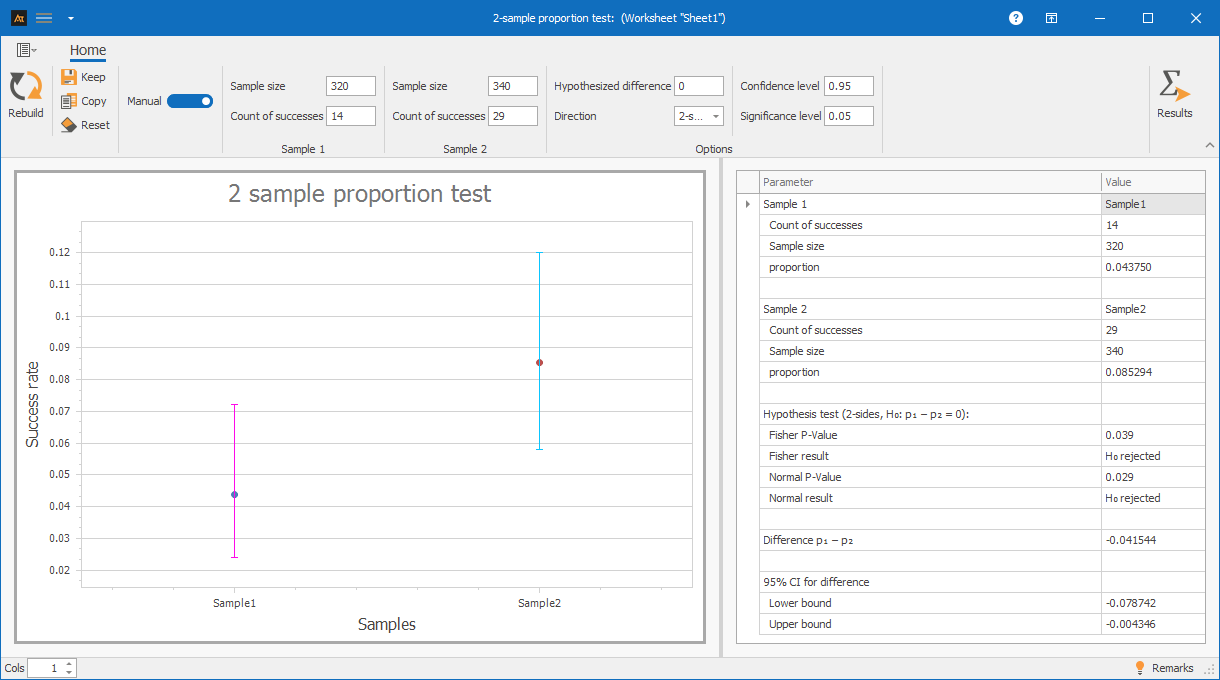
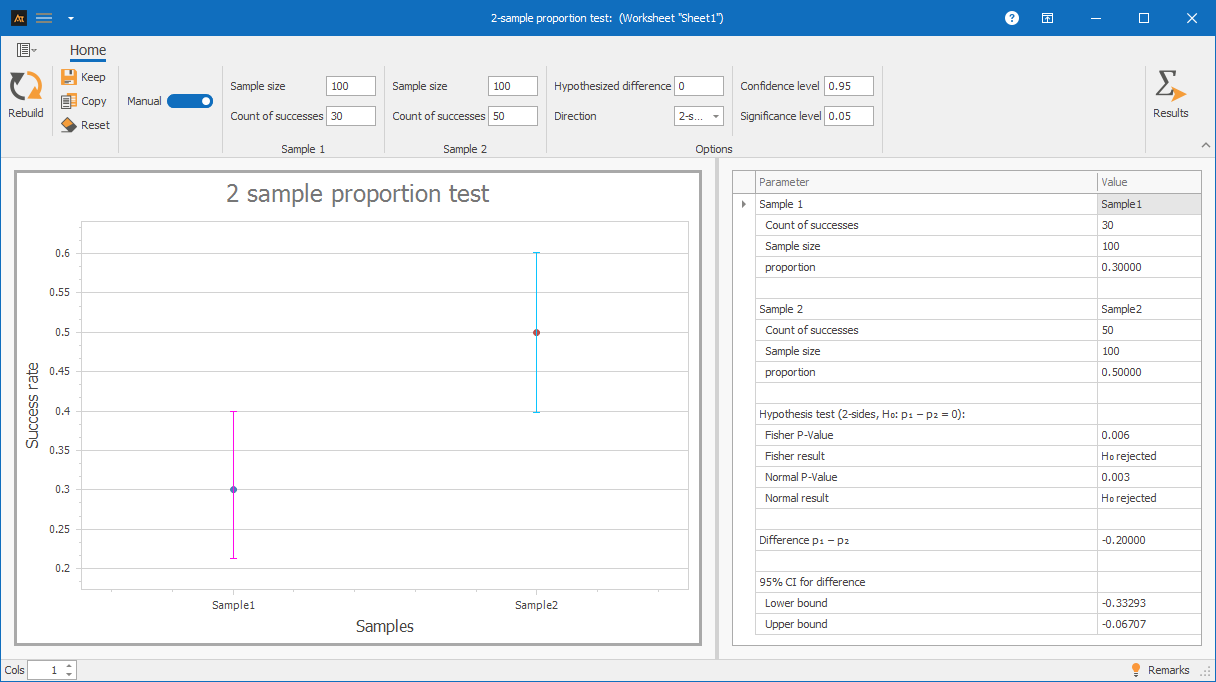
- In the Analyze phase, select the tool “Proportion Test, 2 Samples.”
- Activate the “Manual” slider.
- Under Sample 1, enter 30 for the number of events and 100 for the number of trials.
- Under Sample 2, enter 50 for the number of events and 100 for the number of trials.
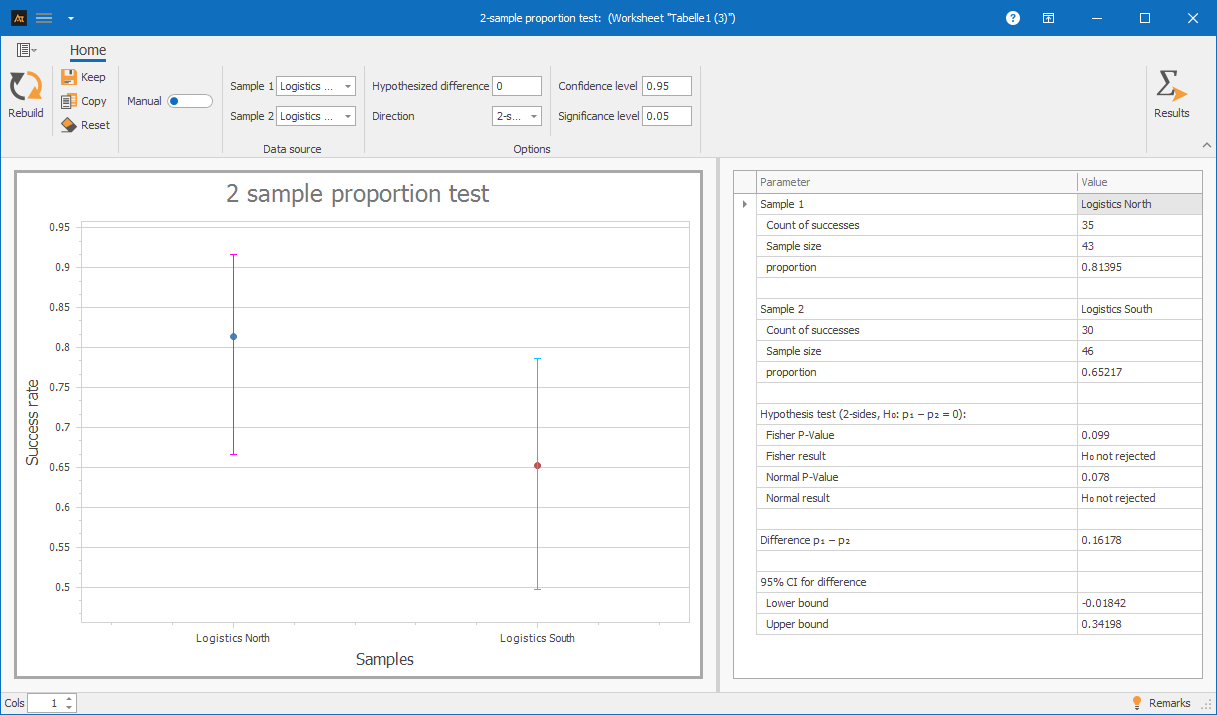
Interpretation
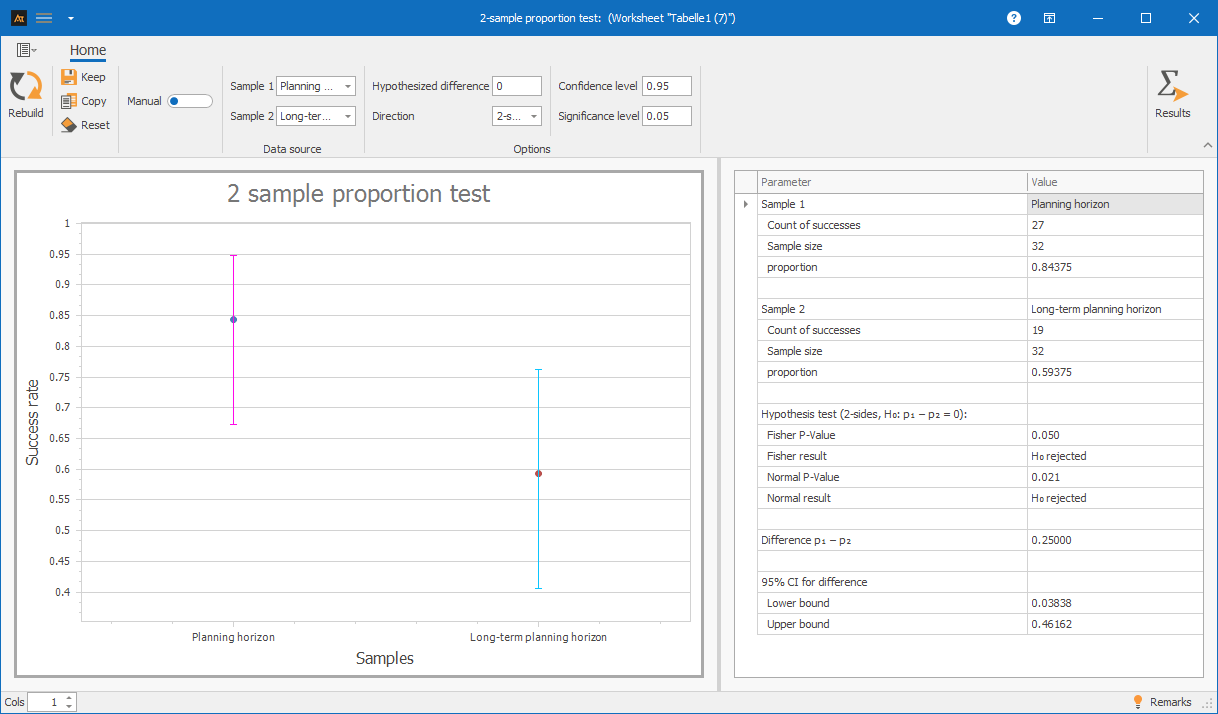
- Check whether the p-value is less than or equal to the significance level.
p ≤ α → statistically significant difference in proportions.
p > α → no statistically significant difference in proportions. Important: The interpretation refers to proportions or the difference in proportions—not to means.
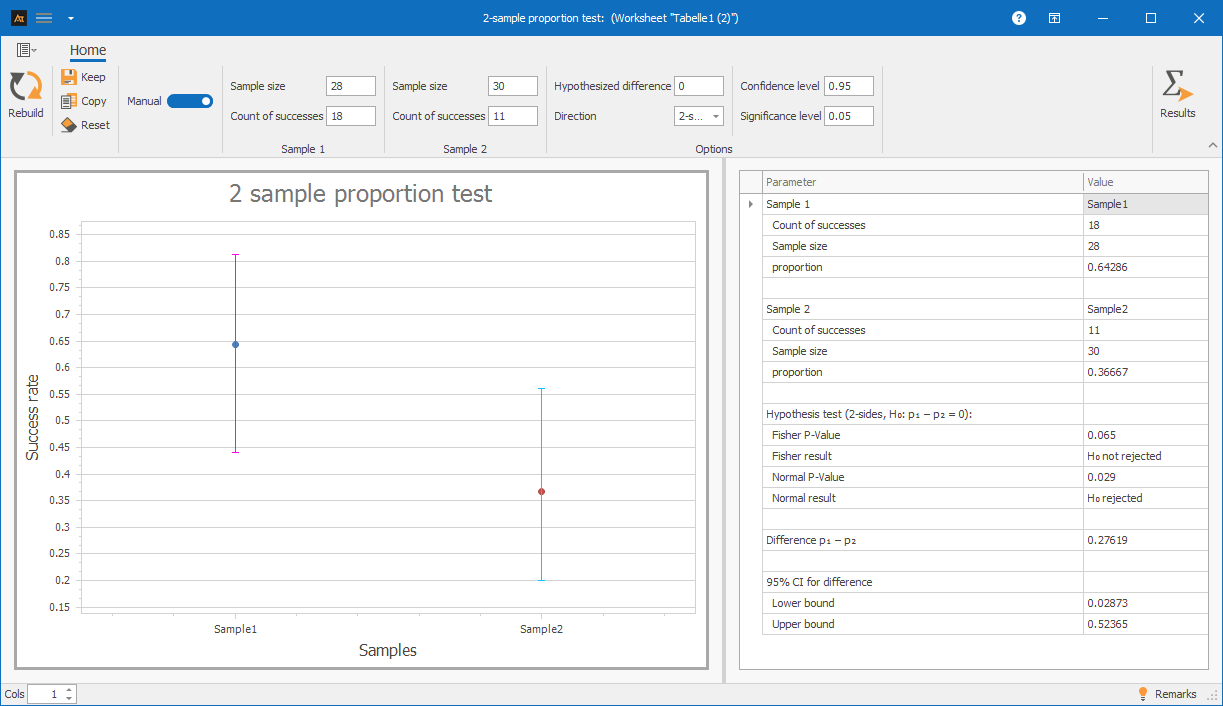
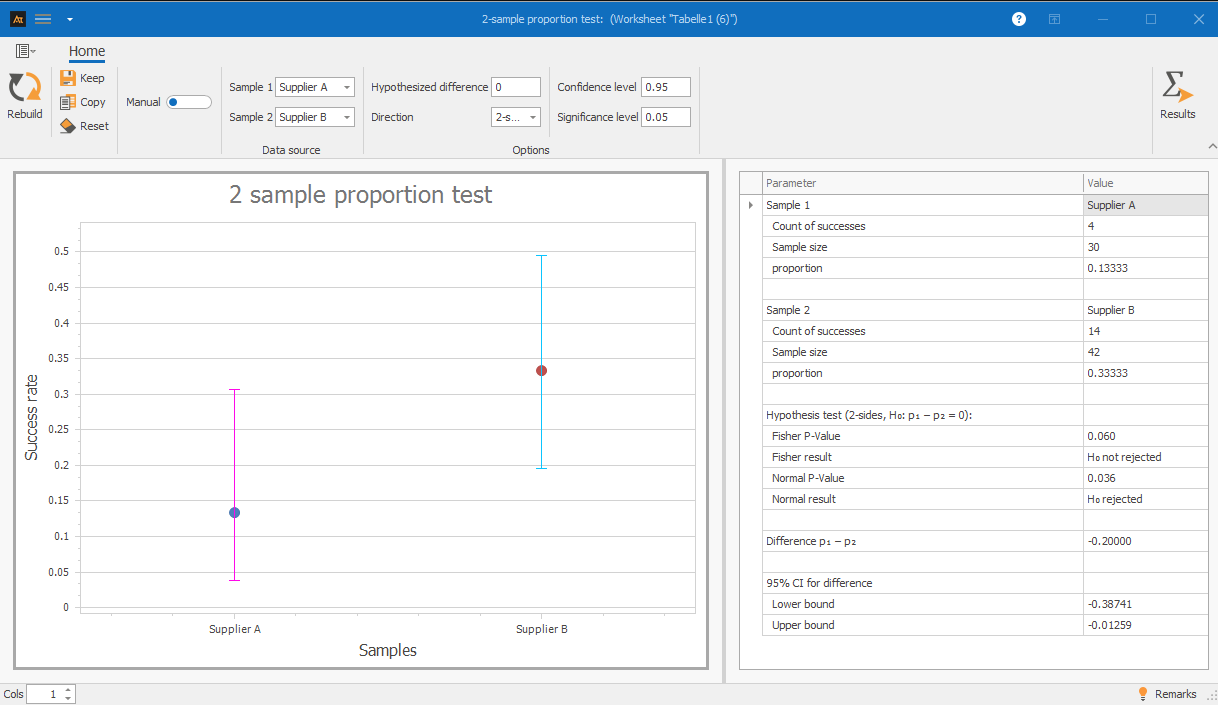
The p-value of Fisher’s exact test is valid for all sample sizes. The normal approximation may be inaccurate if the number of events or non-events in either sample is less than 5.
-
Adjustment options
Data
Manual entry:

The comparison is based on the number of events and the number of trials in both samples.
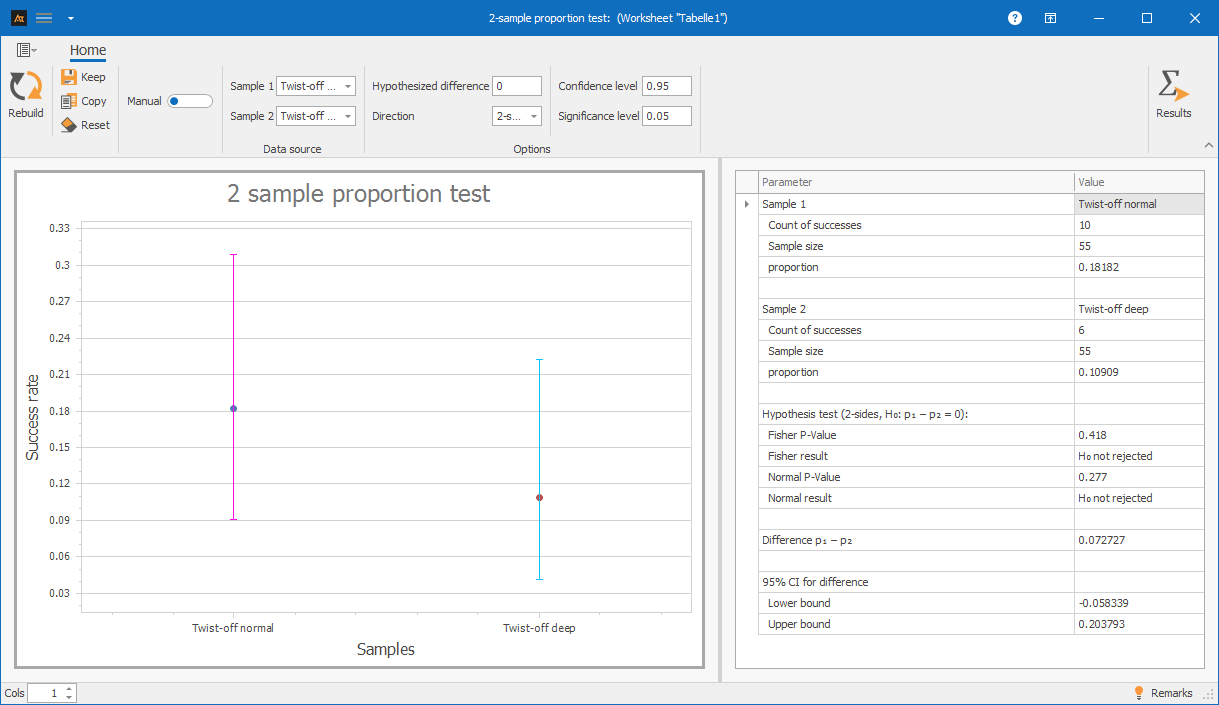
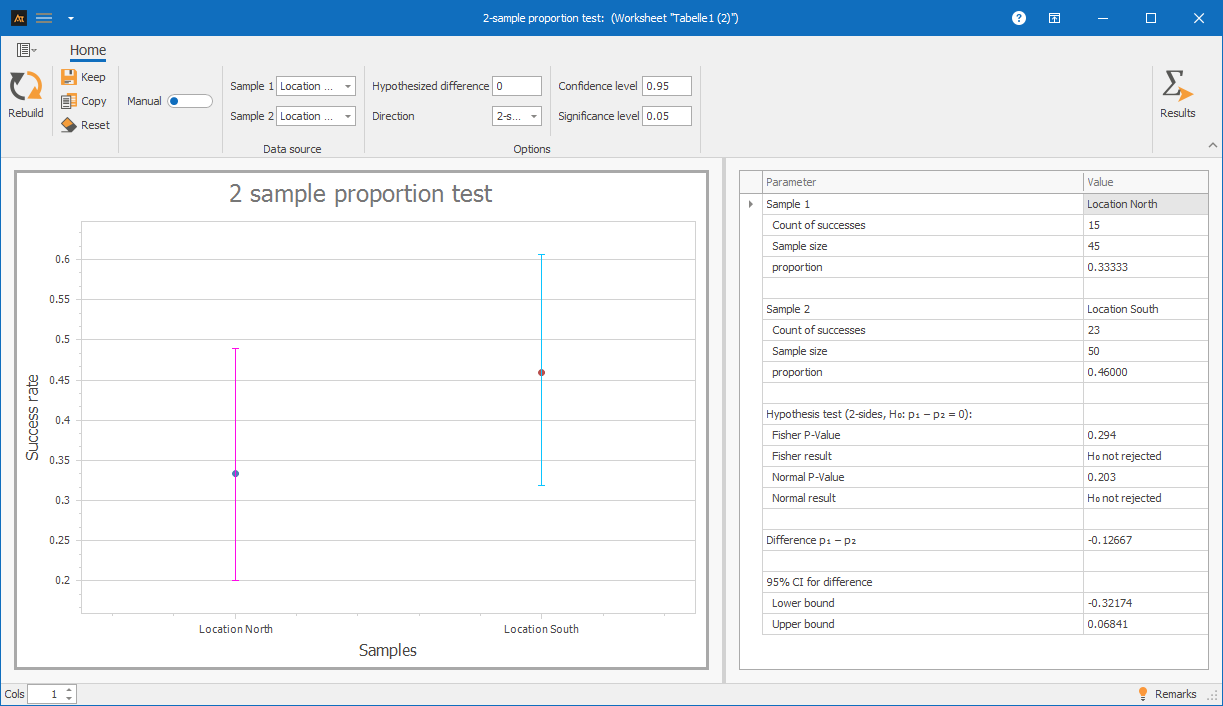
Non-manual entry:

The comparison is based on the selected data columns.
Direction (hypothesis type)
With the direction, you specify what type of difference between the two samples should be tested.
Double-sided
Null hypothesis
H₀: p₁ – p₂ = Δ₀
Alternative hypothesis
H₁: p₁ – p₂ ≠ Δ₀
Select “two-tailed” if you want to test whether the proportions of the two samples differ, without specifying a particular direction.
- The test determines whether the proportion in the first sample is greater than or less than that in the second.
- This setting is useful when there is no specific expectation regarding the direction of the difference.
Example:
Does the rate of leaky jars differ between filling line A and filling line B?
Larger
Null hypothesis
H₀: p₁ – p₂ = Δ₀
Alternative hypothesis
H₁: p₁ – p₂ > Δ₀
Select “Greater” if you want to check whether the proportion in the first sample is greater than that in the second sample.
- The test only checks whether sample 1 has significantly higher proportions than sample 2.
- Differences in the opposite direction are not taken into account.
Example:
Is the proportion of pallets delivered on time higher at the North location than at the South location?
Smaller
Null hypothesis
H₀: p₁ – p₂ = Δ₀
Alternative hypothesis
H₁: p₁ – p₂ < Δ₀
Select “smaller” if you want to check whether the proportion in the first sample is smaller than that in the second sample.
- The test only checks whether sample 1 has significantly lower proportions than sample 2.
- Differences in the opposite direction are not taken into account.
Example:
Is the proportion of mislabeled jars in batch A lower than in batch B?
-
Requirements
Two groups
There must be exactly two groups whose proportions are to be compared (e.g., Group A vs. Group B).
Why is this important?
The two-sample proportion test is a method for comparing two proportions.
Independent samples
The observations of the two groups must not influence each other. Each unit may be assigned to only one group.
Why is this important?
The test assumes that the groups were surveyed independently of one another.
Nominal data with 2 categories
The data must be in the form of event / non-event.
Why is this important?
The test compares proportions based on nominal data that can take exactly two different values. Therefore, only two different values may appear in the two columns.
-
Tools
(When are other options more suitable?)
If you want to compare mean values of continuous measurement data rather than proportions, a t-test is more appropriate.
If percentages are to be compared, a t-test may be appropriate provided that the samples are independent and the values are approximately normally distributed or the sample size is sufficiently large.
If two dependent samples—that is, the same items or individuals—are to be compared, other methods are more appropriate.
Production
Reject rate - Filling line A vs. Filling line B
Two filling lines are used in the production of tomato sauce. The aim is to investigate whether the proportion of leaky jars differs between Machine A and Machine B.
Aggregated data is available for both machines.
- Machine A: 14 leaky jars out of 320 jars tested
- Machine B: 29 leaky jars out of 340 tested
The proportions are compared using a proportion test (2 samples).
Interpretation:
The proportion test indicates a statistically significant difference in the rejection rate between the two machines, since the p-value is less than 0.05. In this case, the p-value from the normal approximation can be used because neither the number of events nor the number of non-events is less than 5. Both the normal approximation and the exact Fisher’s test yield the same result. Since the conditions for the normal approximation are met, it can be used here. Compared to the Fisher’s test, it is often less conservative and therefore may be more likely to indicate significant differences.
Development
Success rate of the new lid design
A new lid design is being tested in the development of tomato sauce. The aim is to determine whether there is a difference in the pass rate of leak tests between the current and the new versions.
Interpretation:
The proportion test shows no statistically significant difference in the success rate of the leak test between the two variants, as the p-value is greater than 0.05. The null hypothesis is retained.
IT Support
First-time resolution rate for service tickets
The IT department of a tomato sauce manufacturer plans to investigate whether there is a difference in the proportion of service tickets resolved directly between the North and South locations.
Interpretation:
The proportion test shows no statistically significant difference in the initial clearance rate between the two sites, as the p-value is greater than 0.05. The null hypothesis is retained.
Sales
Loss ratio by sales approach
The sales department of a tomato sauce manufacturer is conducting a study to determine whether the percentage of lost sales differs between Sales Approach A and Sales Approach B.
Interpretation:
Two different p-values are obtained.
The p-value from the normal approximation indicates a statistically significant difference, so the null hypothesis is rejected.
The p-value from the exact Fisher’s test, on the other hand, is above the significance level, so the null hypothesis is not rejected in this case.
If the conditions for the normal approximation are met, this p-value is generally used for the assessment. The condition is that in both samples, both the number of events and the number of non-events must be at least 5.
This condition is met here. Therefore, the p-value from the normal approximation can be used.
With p = 0.029, the null hypothesis is rejected.
Logistics
Pallets delivered on time by location
In the logistics department of a tomato sauce manufacturer, shipments are prepared at two locations. To improve the process, the goal is to determine whether the North location achieves a higher proportion of pallets delivered on time than the South location.
The aim is to investigate whether the proportion of pallets delivered on time differs according to the chosen alternative hypothesis.
The analysis is performed using a proportion test for two samples as a one-tailed test; in this case, “greater than” was selected.
H₀: p_North – p_South = 0 H₁: p_North – p_South > 0
Interpretation:
The proportion test shows no statistically significant difference in the initial clearance rate between the two sites, as the p-value is greater than 0.05. The null hypothesis is retained.
Shopping
Comparison of suppliers of screw-on lids
The purchasing department sources screw-top lids for tomato sauce jars from two suppliers. The goal is to determine whether the proportion of damaged shipments differs between Supplier A and Supplier B.
Note:
To test proportions, events and trials are counted, for example, “damaged” yes/no per delivery or batch.
When the number of events or non-events is very small, the normal approximation may be inaccurate. In such cases, the exact method is particularly important.
For larger samples, the normal approximation is generally well-suited for practical use.
Interpretation:
There are two different p-values. The p-value from the normal approximation suggests that the null hypothesis should be rejected. The p-value from the exact Fisher test, however, indicates that the null hypothesis cannot be rejected. To apply the normal approximation, both the number of events and the number of counter-events must be sufficiently large in both samples. This condition is not met here, since in Sample 1 the number of counter-events is less than 5. Therefore, the decision is made based on the exact Fisher test. This test shows no statistically significant difference, so the null hypothesis is not rejected.
Planning
Forecast accuracy rate by planning horizon
In the planning process of a tomato sauce manufacturer, the study aims to determine whether there is a significant difference in the proportion of sufficiently accurate sales forecasts between the short-term and long-term planning horizons.
Interpretation:
Both the p-value of the exact Fisher’s test and the p-value of the normal approximation are at or below the 5% significance level. Both tests thus indicate a statistically significant difference. The null hypothesis is rejected.
-
Terms
Binary data: Data with exactly two possible outcomes, e.g., yes/no, lid tight/leaky, or success/failure.
Normal approximation: An approximation method for calculating the test statistic and the confidence interval for proportions; well-suited for sufficiently large samples.
p̂ = sample proportion: Proportion of events in a sample; calculated as events / number of trials.
Event: The specific success event of interest in the sample, e.g., “lid leaky” or “label correctly affixed.”
n = sample size: Number of observations or trials within a sample.
α = significance level: Specified probability of error with which the null hypothesis is incorrectly rejected.
p-value: Probability of obtaining a result at least as extreme as the observed one, assuming the null hypothesis.
z-value: Test statistic of the proportion test. It describes how large the observed difference in proportions is relative to the expected variance.
Fisher’s exact test: An exact test method for comparing two proportions; particularly important for small samples or small numbers of events.
Δ₀ = Hypothesis difference: Reference value against which the difference in proportions is tested. Usually, Δ₀ = 0.
Confidence level: Probability that the calculated confidence interval will cover the true parameter value if the sample is drawn repeatedly (e.g., 95%).
Confidence interval: Range of values that plausibly contains the true difference in proportions at the chosen confidence level.
H₀ = Null hypothesis: Initial hypothesis assuming no difference or the hypothesized difference. It is tested in the hypothesis test.
H₁ = Alternative hypothesis: The hypothesis opposing the null hypothesis. It describes the substantive research question, e.g., whether proportions differ or whether there is a direction (greater/lesser).
Test direction: Specifies whether a difference is tested without specifying the direction (two-sided) or with a specific direction (greater/lesser).
Two-tailed: The test examines whether the proportions differ, regardless of the direction.
Greater: The test examines whether the proportion of the first sample is greater than that of the second sample.
Smaller: The test examines whether the proportion of the first sample is smaller than that of the second sample.
-
Keywords