Purpose of the tool
Procedure
Settings
Interpretation guide
Forms of representation
Requirements
Tools
Examples
Terms
Formulas
-
Purpose of the tool
The Benefit-and-Effort Matrix is used to systematically evaluate and compare initiatives or projects in terms of their benefits and the effort required. The matrix is designed to be visually intuitive, enabling management to make decisions quickly.
-
Example: Prioritizing Projects
Three potential projects were compared during a project selection process. Management will decide which projects to implement and which not to.
Projects:
- Kaizen Workshop 5S
- New Production Data Collection (PDC)
- Optimization of Lead Time
Result:
Project 1 is in the blue zone; it should therefore be implemented.
Project 2 is in the yellow zone; it is a management decision.
Project 3 is in the green zone; it should be implemented.
Explanation of the chart:
Blue zone: (Quick Hit or quick solution): Moderate benefit with low effort. These should be prioritized for implementation. These are projects that can generally be completed in a few days or weeks with low risk.
Green area: High benefit with low or moderate effort. These are projects that may take a little longer—typically 3–6 months—and for which the risk of failure is low. These should be scheduled and implemented.
Yellow Zone: You get out what you put in. A further evaluation can be conducted, or management may decide to proceed as an investment for the future.
Red Zone: The effort required is high relative to the benefit. Such measures or projects should be avoided.
-
Procedure
(How was this graphic created?)
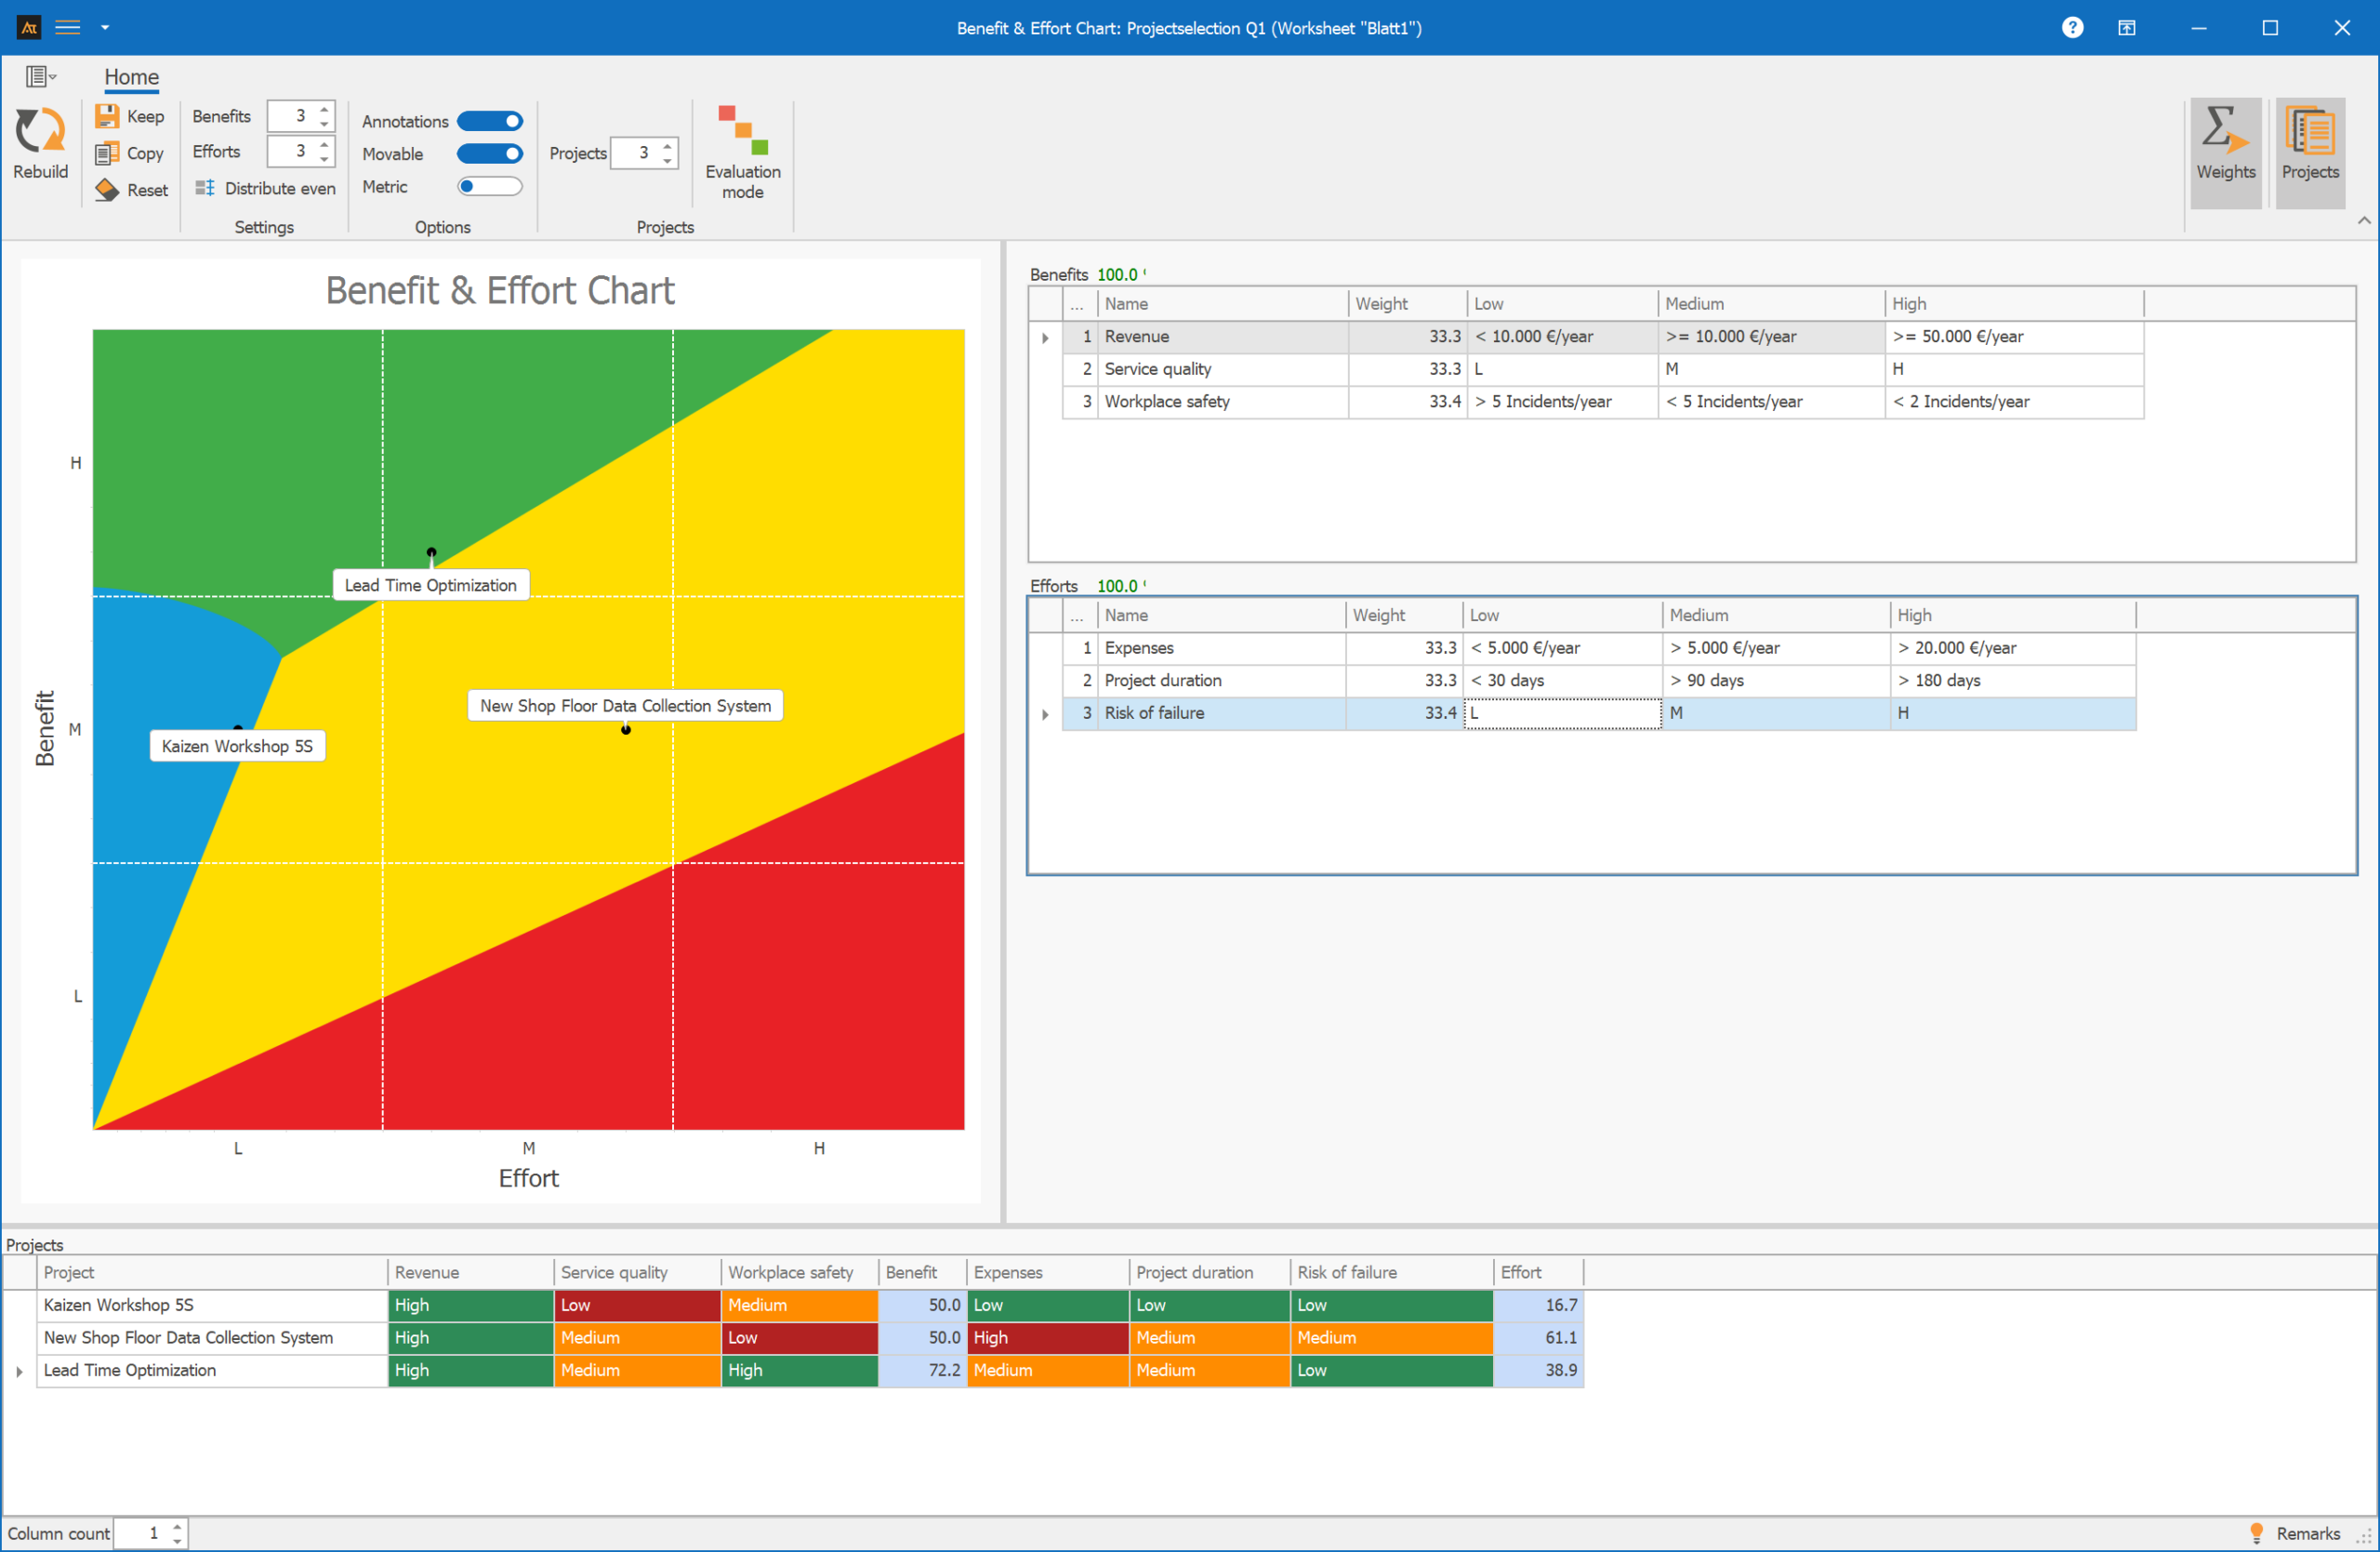
Select the B&E Matrix tool (if applicable, during the Improve phase). When you first launch the tool, you’ll see two tables on the right-hand side showing benefits and efforts. These are pre-populated.
You can increase the number of rows using this setting:

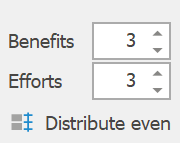
Make sure that the sum of all weights in the tables always adds up to 100%. You can change this manually or use the “Distribute Even” button to distribute the values evenly.
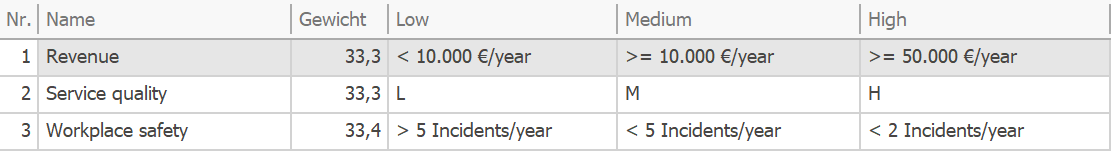
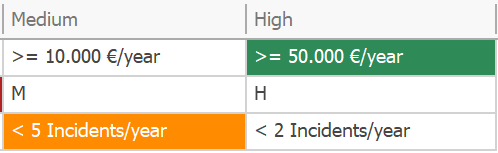
You can manually edit these settings in both tables. These are merely guidelines for how you might later classify them as “Low,” “Medium,” or “High.”
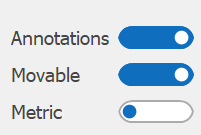
Options:
With “Annotations,” you can turn the labels in the projects on or off. With “Movable,” you can move the labels. With “Metric,” the axes are displayed with numbers instead of H, M, L.

Start evaluation:
Once the Benefit and Effort tables are filled out and the number of projects has been set under:

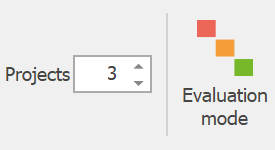
Select the button: Evaluation mode.
This will lock some fields, and you can select a project at the bottom of the table (select row) and then enter “High,” “Medium,” or “Low” for the benefit and effort in the corresponding cells.
It’s even faster if you select the row and click directly into the cells in the tables on the right (Benefits and Efforts) with the mouse.

Once you have completed your evaluations for all projects, click “Rebuild,” and the projects will be displayed in the chart.
-
Requirements
For a meaningful analysis, it is important that all measures under consideration are clearly described and distinguishable from one another. Only then can a comparable evaluation be conducted. In addition, benefits and costs should be evaluated according to uniform criteria to avoid subjective biases and ensure consistent prioritization. A clear evaluation framework is essential for ensuring that the results are transparent and reliable.
• Clearly defined measures or projects•
Uniform evaluation criteria
-
Terms
Benefit: Expected added value of an initiative
Effort: Resources required for implementation
Quick Hit: An initiative with high benefit and low effort
-
Keywords