To provide you with the best possible experience, we use technologies such as cookies to store and/or access device information. If you consent to these technologies, we may process data such as browsing behavior or unique IDs on this website. If you do not give or withdraw your consent, certain features and functions may be affected.
The technical storage or access that is used exclusively for anonymous statistical purposes. Without a subpoena, voluntary compliance from your Internet Service Provider, or additional records from a third party, the information stored or retrieved for this purpose alone usually cannot be used to identify you.
The technical storage or access is required for the legitimate purpose of storing preferences that are not requested by the subscriber or user.
The technical storage or access is required for the legitimate purpose of storing preferences that are not requested by the subscriber or user.
The technical storage or access that is used exclusively for anonymous statistical purposes. Without a subpoena, voluntary compliance from your Internet Service Provider, or additional records from a third party, the information stored or retrieved for this purpose alone usually cannot be used to identify you.
The technical storage or access is required to create user profiles, to send advertising, or to track the user on a website or across multiple websites for similar marketing purposes.
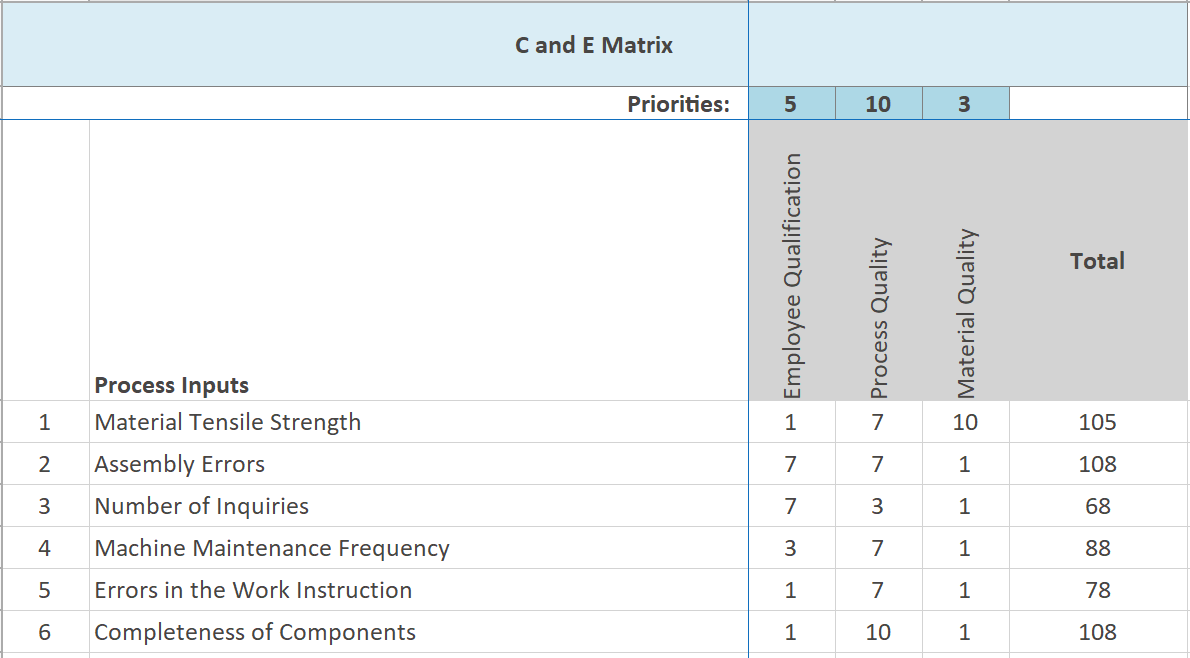
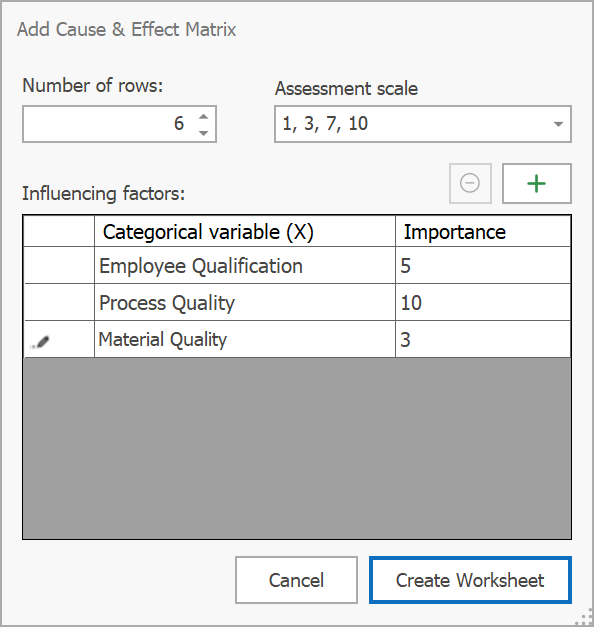
 Using it in AlphadiTab